
Decoding Critical Aortic Stenosis: A Guide to Spotting the Heart's Sneaky Traffic Jam with Ultrasound
John Bowling, DO, RDCS
Robert Stenberg, MD, RDCS, RDMS
Cleveland Clinic Akron General
Your elderly patient that presented with syncope is having lower blood pressures now. Your young patient with a systolic murmur is having worsening shortness of breath. EMS is bringing in a patient with systolic blood pressures in the 70s with angina and no STEMI on ECG. We’ve all been in these situations before.
Sometimes……critical aortic stenosis is the answer…..and you will never know unless you look.
Aortic stenosis (AS) is the most common valvular disease in the developed world and carries a high mortality rate in symptomatic patients. Etiologies of AS can be congenital (think bicuspid aortic valve), calcific, and rheumatic. Clinical deterioration occurs rapidly within two to three years of symptoms if left untreated. The most common symptoms of AS include angina, syncope, and heart failure which are all common presentations in the emergency department (ED).1,2 The normal orifice of the aortic valve (AV) is approximately 3 cm.2 When reduced by half, the transvalvular pressure gradient increases significantly leading to left ventricular (LV) hypertrophy. LV hypertrophy eventually leads to impaired coronary blood flow and worsening heart failure. Consequently, increased oxygen demand causes angina.1 Overall, the pathophysiology of AS leads to a preload-dependent lesion.2
So what is critical AS? Well…. it’s critical! Sometimes, patients have aortic stenosis so bad, that it causes profound symptoms and leads to shock. Patients with critical AS have a fixed cardiac output and cannot increase cardiac output to meet the physiologic demands of critical illness. Given the hemodynamics and preload-dependence of AS, point-of-care ultrasound (POCUS) is an essential tool that can impact the management of patients in shock and identification of critical AS.3
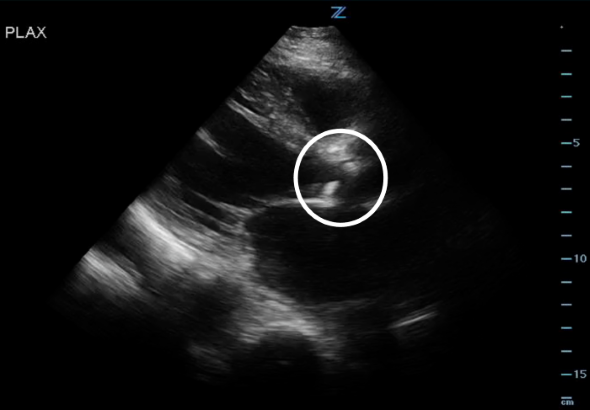 Figure 1. PLAX view showing the stenotic and calcified AV.
“Well…why can’t you just use your clinical examination and listen for a classic crescendo-decrescendo systolic ejection murmur upon auscultation of the right upper sternal border?” Well… patients with critical disease such as those presenting with syncope and shock will not have a murmur due to the reduction of stroke volume.1,2
So…how do you diagnose critical AS on ultrasound?
Just eyeball it!
- Obtain a parasternal long axis (PLAX) and right ventricular outflow view (RVOT) and examine the aortic valve leaflets. Is there AV calcification? How’s the AV leaflet mobility? Is there also LV hypertrophy? Several studies have found that novice sonographers have been able to accurately pick up severe aortic stenosis.4-6
*Notice how calcified the AV leaflets are and how little the valve orifice opens.
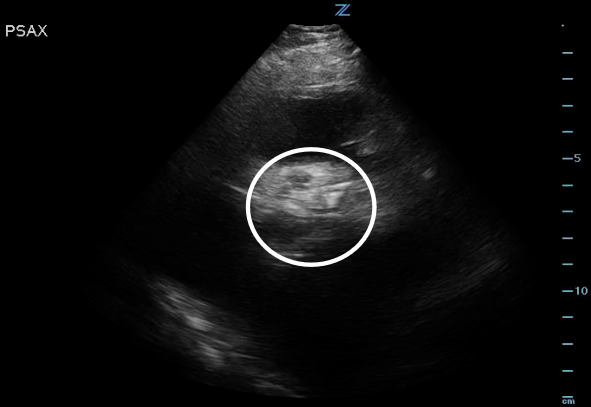
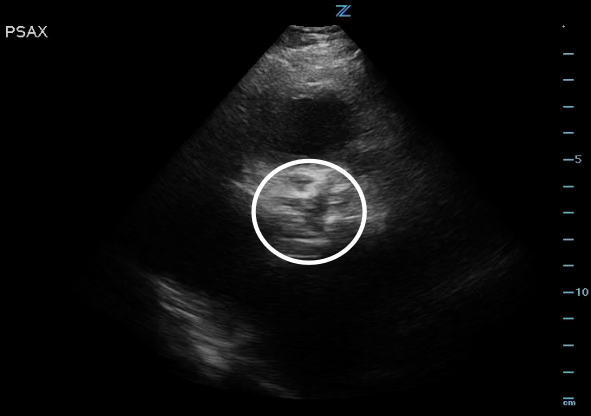 Figure 2. High PSAX (RVOT) view of the AV orifice (circled) closed.
Figure 3. High PSAX (RVOT) view of the AV orifice (circled) open.
Measure it!
- Three main physiologic parameters are assessed in quantitative assessment: AV area, peak aortic velocity (Vmax), and mean transaortic gradient. To get these parameters, follow these instructions:
- Obtain a PLAX and measure the LVOT cross sectional area (by measuring LVOT diameter).
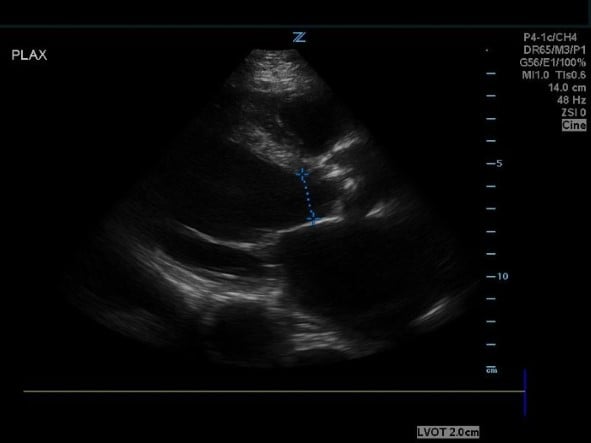 Figure 4. PSAX view measuring the LVOT cross sectional area.
Utilize the cardiac preset and obtain an apical five-chamber (A5CH) view with a focus on the AV.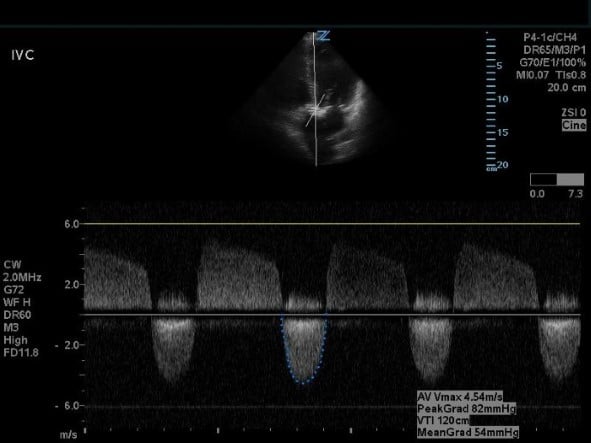 Figure 5. Apical five-chamber view with continuous wave doppler on the AV.
- Obtain AV measurements with continuous wave doppler (CWD) through the AV. Trace the downward, systolic waveform to calculate the AV VTI and peak aortic velocity (Vmax).
- Switch to pulse wave doppler (PWD) in the same A5CH view and place the doppler gate through the LVOT. Trace the obtained waveform in the same fashion to calculate the LVOT VTI. To also calculate cardiac output, measure the heart rate during this step using the machine preset.
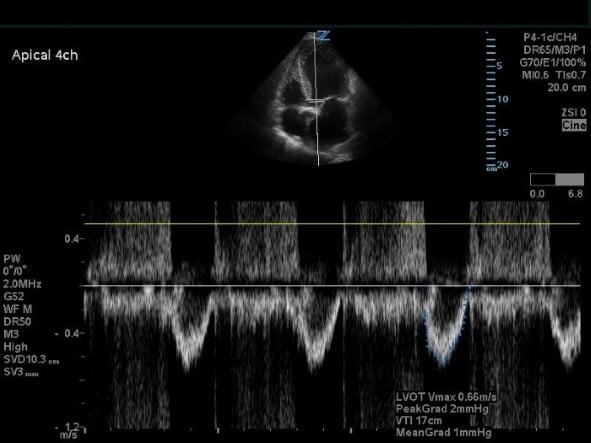 Figure 6. Apical five-chamber view with pulse wave doppler on the LVOT.
 Figure 7. Report showing the mean gradient and AV area.
- Utilize the report feature (can be machine-specific but often on machines with cardiac packages that will do calculations). The AV area, Vmax, and mean transaortic gradient will be displayed.
An AV area <1.0 cm2, peak aortic velocity >4 m/s, mean transaortic gradient >40 mmHg is diagnostic for critical AS, however, in cases of depressed ejection fraction, AV area <1.0 cm2 can be the only abnormal parameter.7
Good job! You’ve successfully identified critical AS in your sick patient. Make sure to optimize that preload, avoid excessive tachycardia, treat hypotension with vasopressors, and get them the AV valve replacement they so desperately need!
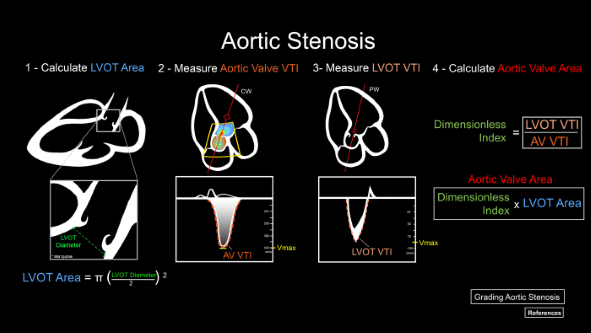
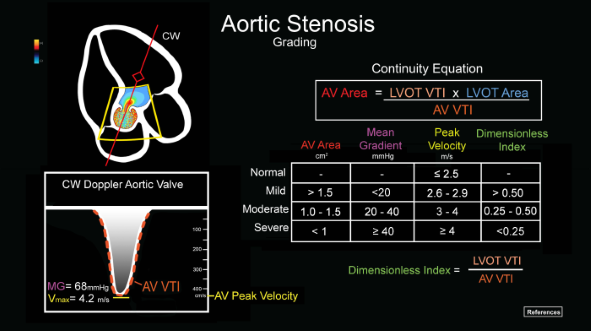
Figure 8. Quantitative measurements of aortic stenosis.
Figure 9. Quantitative grading of aortic stenosis.
References
- Gottlieb M, Long B, Koyfman A. Evaluation and Management of Aortic Stenosis for the Emergency Clinician: An Evidence-Based Review of the Literature. J Emerg Med. 2018;55(1):34-41.
- Carabello BA, Paulus WJ. Aortic stenosis. The Lancet. 2009;373(9667):956-66.
- Daly M, Long B, Koyfman A, Lentz S. Identifying cardiogenic shock in the emergency department. Am J Emerg Med. 2020;38(11):2425-33.
- Alzahrani H, Woo MY, Johnson C, Pageau P, Millington S, Thiruganasambandamoorthy V. Can severe aortic stenosis be identified by emergency physicians when interpreting a simplified two-view echocardiogram obtained by trained echocardiographers? Crit Ultrasound J. 2015;7:5.
- Furukawa A, Abe Y, Morizane A, Miyaji T, Hosogi S, Ito H. Simple echocardiographic scoring in screening aortic stenosis with focused cardiac ultrasonography in the emergency department. J Cardiol. 2021;77(6):613-19.
- Gulič TG, Makuc J, Prosen G, Dinevski D. Pocket-size imaging device as a screening tool for aortic stenosis. Wiener klinische Wochenschrift. 2015;128(9-10):348-53.
- Echocardiographic Assessment of Aortic Valve Stenosis: A Focused Update. www.asecho.org,
